
There have been two blockbuster trades in the NFL as we approach the 2016 Draft on April 28-30. The LA Rams traded for the #1 overall pick, and separately, the Philadelphia Eagles traded for the #2 overall pick. However, both teams trading up had to give up a considerable amount in exchange for the right to draft early this year.
Did they make trading decisions with positive expectancy? Let’s think about it.
April 14, 2016: LA Rams trade with Tennessee Titans
- Rams: Get 2016 1st overall Pick, 2016 113th pick (4th round), 2016 117th pick (6th round).
- Titans: Get 2016 15th overall pick, 2016 43rd and 45th pick (2nd round), 2016 76th pick (3rd round), 2017 1st and 2017 3rd round pick.
April 20, 2016: Philadelphia Eagles trade with Cleveland Browns
- Eagles: Get 2016 2nd overall pick, 2017 4th round pick.
- Browns: Get 2016 8th overall pick, 2016 77th pick (3rd round), 100th pick (4th round), 2017 1st round pick, 2018 2nd round pick.
Brian Burke of ESPN Analytics has some good analysis regarding the Rams trade and the Eagles trade. FiveThirtyEight also writes that the NFL draft is an efficient market, citing multiple studies examples showing that teams cannot consistently outperform the draft.
Bottom line: Both teams gave up too much to trade up! Why though? It seems that there are a few prominent effects going on here that have real impact on decision making.
Externalities: Winning Now vs Winning in the Future
There’s certainly an incentive for NFL executives and coaches to win today, rather than 5 years in the future. Managers and coaches may not even be around 5 years from now! This creates an incentive to “mortgage the future” in order to try to win today. If the pick doesn’t work out, they won’t be around to feel the consequences anyway!
Anchoring
- When evaluating draft pick trades, many NFL teams still rely on a a draft evaluation chart created by Jimmy Johnson of the Dallas Cowboys in the early 1990’s. However, over 20+ years, there has been a drastic improvement in sports analytics, leading to a huge gap between people still using the Jimmy Johnson draft chart and people who are using more modern methods of valuation.
- In trading, we say that people using the Jimmy Johnson chart are anchored to those values. When you know your draft partner is using outdated information, you can likely extract a lot of value by trading with them!
- NFL teams need to continually update their assumptions as new information emerges, or else the marketplace will punish them.
The following chart illustrates the discrepancy between the Jimmy Johnson chart and the average Approximate Value (AV) a player provides for a given draft pick slot. AV is a concept created by pro-football-reference attempting to assign value to football players so that they can be compared across positions.

As this graph shows, anyone who uses the Jimmy Johnson chart is going to massively overvalue the top picks of the draft.
Overconfidence & Recency Bias
Let’s face it: everyone thinks they can pick the next Aaron Rodgers or Tom Brady. Teams vastly overestimate the probability that they actually get an elite franchise player.
Humans have a tendency to overweight recent events in extrapolating what will happen in the future. In the past several years, we have seen QB’s who were drafted early see some degree of success: Marcus Mariota and Jameis Winston in 2015, Blake Bortles in 2014, Andrew Luck in 2012. However, the failures from before then get conveniently swept away from memory: JaMarcus Russell in 2007, Vince Young in 2006, Alex Smith in 2005, Tim Couch in 1999, Ryan Leaf in 1998.
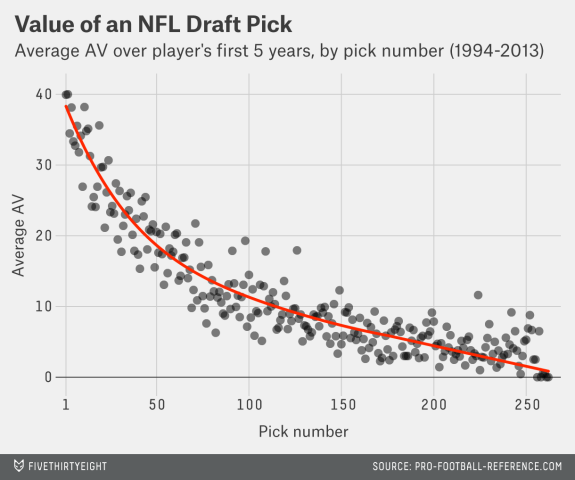
From the chart above, you can see the AV for a first overall pick from 1994-2913 is about 40.
The Eagles’ current quarterback, Sam Bradford, was a former #1 overall pick in 2010 and has an AV of 33. Robert Griffin III, a highly touted #2 overall pick in 2012 by the Washington Redskins (who acquired that pick through another blockbuster trade) has an AV of 32.
Aaron Rodgers on the other hand, has an AV of 112.
Everyone thinks they are picking the next Aaron Rodgers, but ignoring the average performance of a #1 overall pick. By trading up to a top pick, teams are paying an expectant price assuming that their pick will be a superstar.
Overall, we have a mountain of evidence supporting that the way to beat the NFL draft is not to out-pick your opponents, but to trade with teams that are trying to beat the draft!
h/t to Sri, Scott, and Ricky, Equity Options Traders


Subscribe Now
Get each new post sent straight to your inbox