
Every year at Susquehanna, we celebrate the Super Bowl with a firm-wide Super Bowl Sweepstakes. This year, every employee was randomly assigned Cincinnati or Los Angeles as the winner and the last digit of each team’s final score. In order to win, both the team you were assigned needed to win and the last digit of each team’s final score needed to match the numbers you were assigned. Each lucky winner had the option to choose either two Ethereum or $6,232.47 (the cash equivalent of two Ethereum on February 11, 2022).
Using Susquehanna Sport’s NFL simulation model based on approximately 1 million simulations, I put together probabilities of winning each square on the Cincinnati Grid (based on assumption the Bengals won) and the Los Angeles Grid (based on the assumption that the Rams won). Below I walk through a few interesting insights from the probabilities of each square.
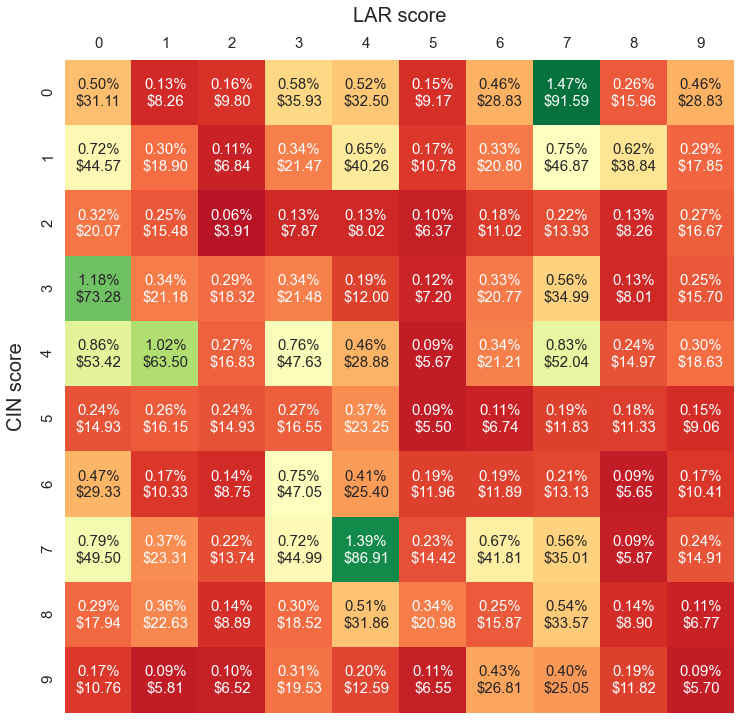
Cincinnati Grid
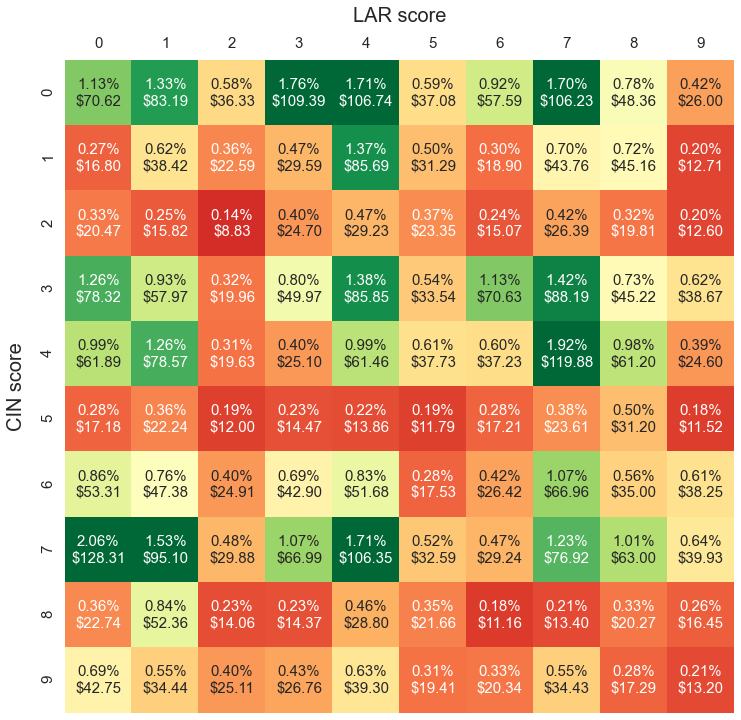
Los Angeles Grid
What were the best and worst possible squares?
Best 5 squares conditioned on Cincinnati winning:
| LAR SCORE | CIN SCORE | PROBABILITY | CONDITIONED ON CIN WINNING | EQUITY |
| 7 | 0 | 1.47% | 4.21% | $91.59 |
| 4 | 7 | 1.39% | 3.98% | $86.91 |
| 0 | 3 | 1.18% | 3.38% | $73.28 |
| 1 | 4 | 1.02% | 2.92% | $63.50 |
| 0 | 4 | 0.86% | 2.46% | $53.42 |
Worst 5 squares conditioned on Cincinnati winning (also worst 5 overall):
| LAR SCORE | CIN SCORE | PROBABILITY | CONDITIONED ON CIN WINNING | EQUITY |
| 2 | 2 | 0.06% | 0.17% | $3.91 |
| 5 | 5 | 0.09% | 0.26% | $5.50 |
| 8 | 6 | 0.09% | 0.26% | $5.65 |
| 5 | 4 | 0.09% | 0.26% | $5.67 |
| 9 | 9 | 0.09% | 0.26% | $5.70 |
Best 5 squares conditioned on Los Angeles winning (also best 5 overall):
| LAR SCORE | CIN SCORE | PROBABILITY | CONDITIONED ON LAR WINNING | EQUITY |
| 0 | 7 | 2.06% | 3.17% | $128.31 |
| 7 | 4 | 1.92% | 2.95% | $119.88 |
| 3 | 0 | 1.76% | 2.71% | $109.39 |
| 4 | 0 | 1.71% | 2.63% | $106.74 |
| 4 | 7 | 1.71% | 2.63% | $106.35 |
Worst 5 squares conditioned on Los Angeles winning:
| LAR SCORE | CIN SCORE | PROBABILITY | CONDITIONED ON LAR WINNING | EQUITY |
| 2 | 2 | 0.14% | 0.22% | $8.83 |
| 6 | 8 | 0.18% | 0.28% | $11.16 |
| 9 | 5 | 0.18% | 0.28% | $11.52 |
| 5 | 5 | 0.19% | 0.29% | $11.79 |
| 2 | 5 | 0.19% | 0.29% | $12.00 |
Why are squares with the same score for each team so bad?
Since the Super bowl can’t end in a tie, in order for a square where each team has the same score, say for example LAR 1 – CIN 1, to hit, the differential at the end of the game has to be at least 10. However, the two teams are close enough in strength that a double-digit victory for either team was unlikely (Los Angeles was a 4.5 point favorite); in our simulations, Los Angeles wins by double-digits 34.4% of the time and Cincinnati wins by double-digits 12.0% of the time, so these squares are especially bad for Cincinnati. That also explains why the squares on the 0-0 to 9-9 diagonal all have more than twice the equity in the Los Angeles grid than in the Cincinnati grid despite Los Angeles being less than 2/3 to win the game.
Why do some Cincinnati squares have higher equity than their Los Angeles counterpart?
For example, look at the LAR 0 – CIN 1 square in both grids. Despite Cincinnati being 35-65 dogs, this square has more than 2.5 times the equity in the Cincinnati grid than in the Los Angeles grid! If Cincinnati wins, the LAR 0 – CIN 1 square can only hit if Cincinnati wins by 1, 11, 21, etc, and winning by 1 is most likely. Likewise, if Los Angeles wins, the LAR 0 – CIN 1 square can only hit if Los Angeles wins by 9, 19, 29, etc and winning by 9 is most likely. According to our simulations, Cincinnati wins by one point 2.64% of the time and Los Angeles wins by nine points 1.58% of the time. Even though the two outcomes are roughly the same distance from the opening spread (Los Angeles -4.5), football scoring effects make 9-point victories less likely. Since the highest number of points a team can score on one drive is 8, teams make choices toward the end of the game to get the margin strictly less than 9 (e.g., they can go for two after a touchdown, go for it on fourth down instead of kicking a field goal, etc).

Subscribe Now
Get each new post sent straight to your inbox